Features / Insights
Measure
The monthly numbers, in the same place as the work
Insights is the reporting view for a workspace: pick a period, read the tiles and charts, and open a post or a story. Facebook and Instagram stories have their own archive. TikTok, LinkedIn, and Pinterest sit in the same place when those profiles are connected. Paid media has its own Ads page.

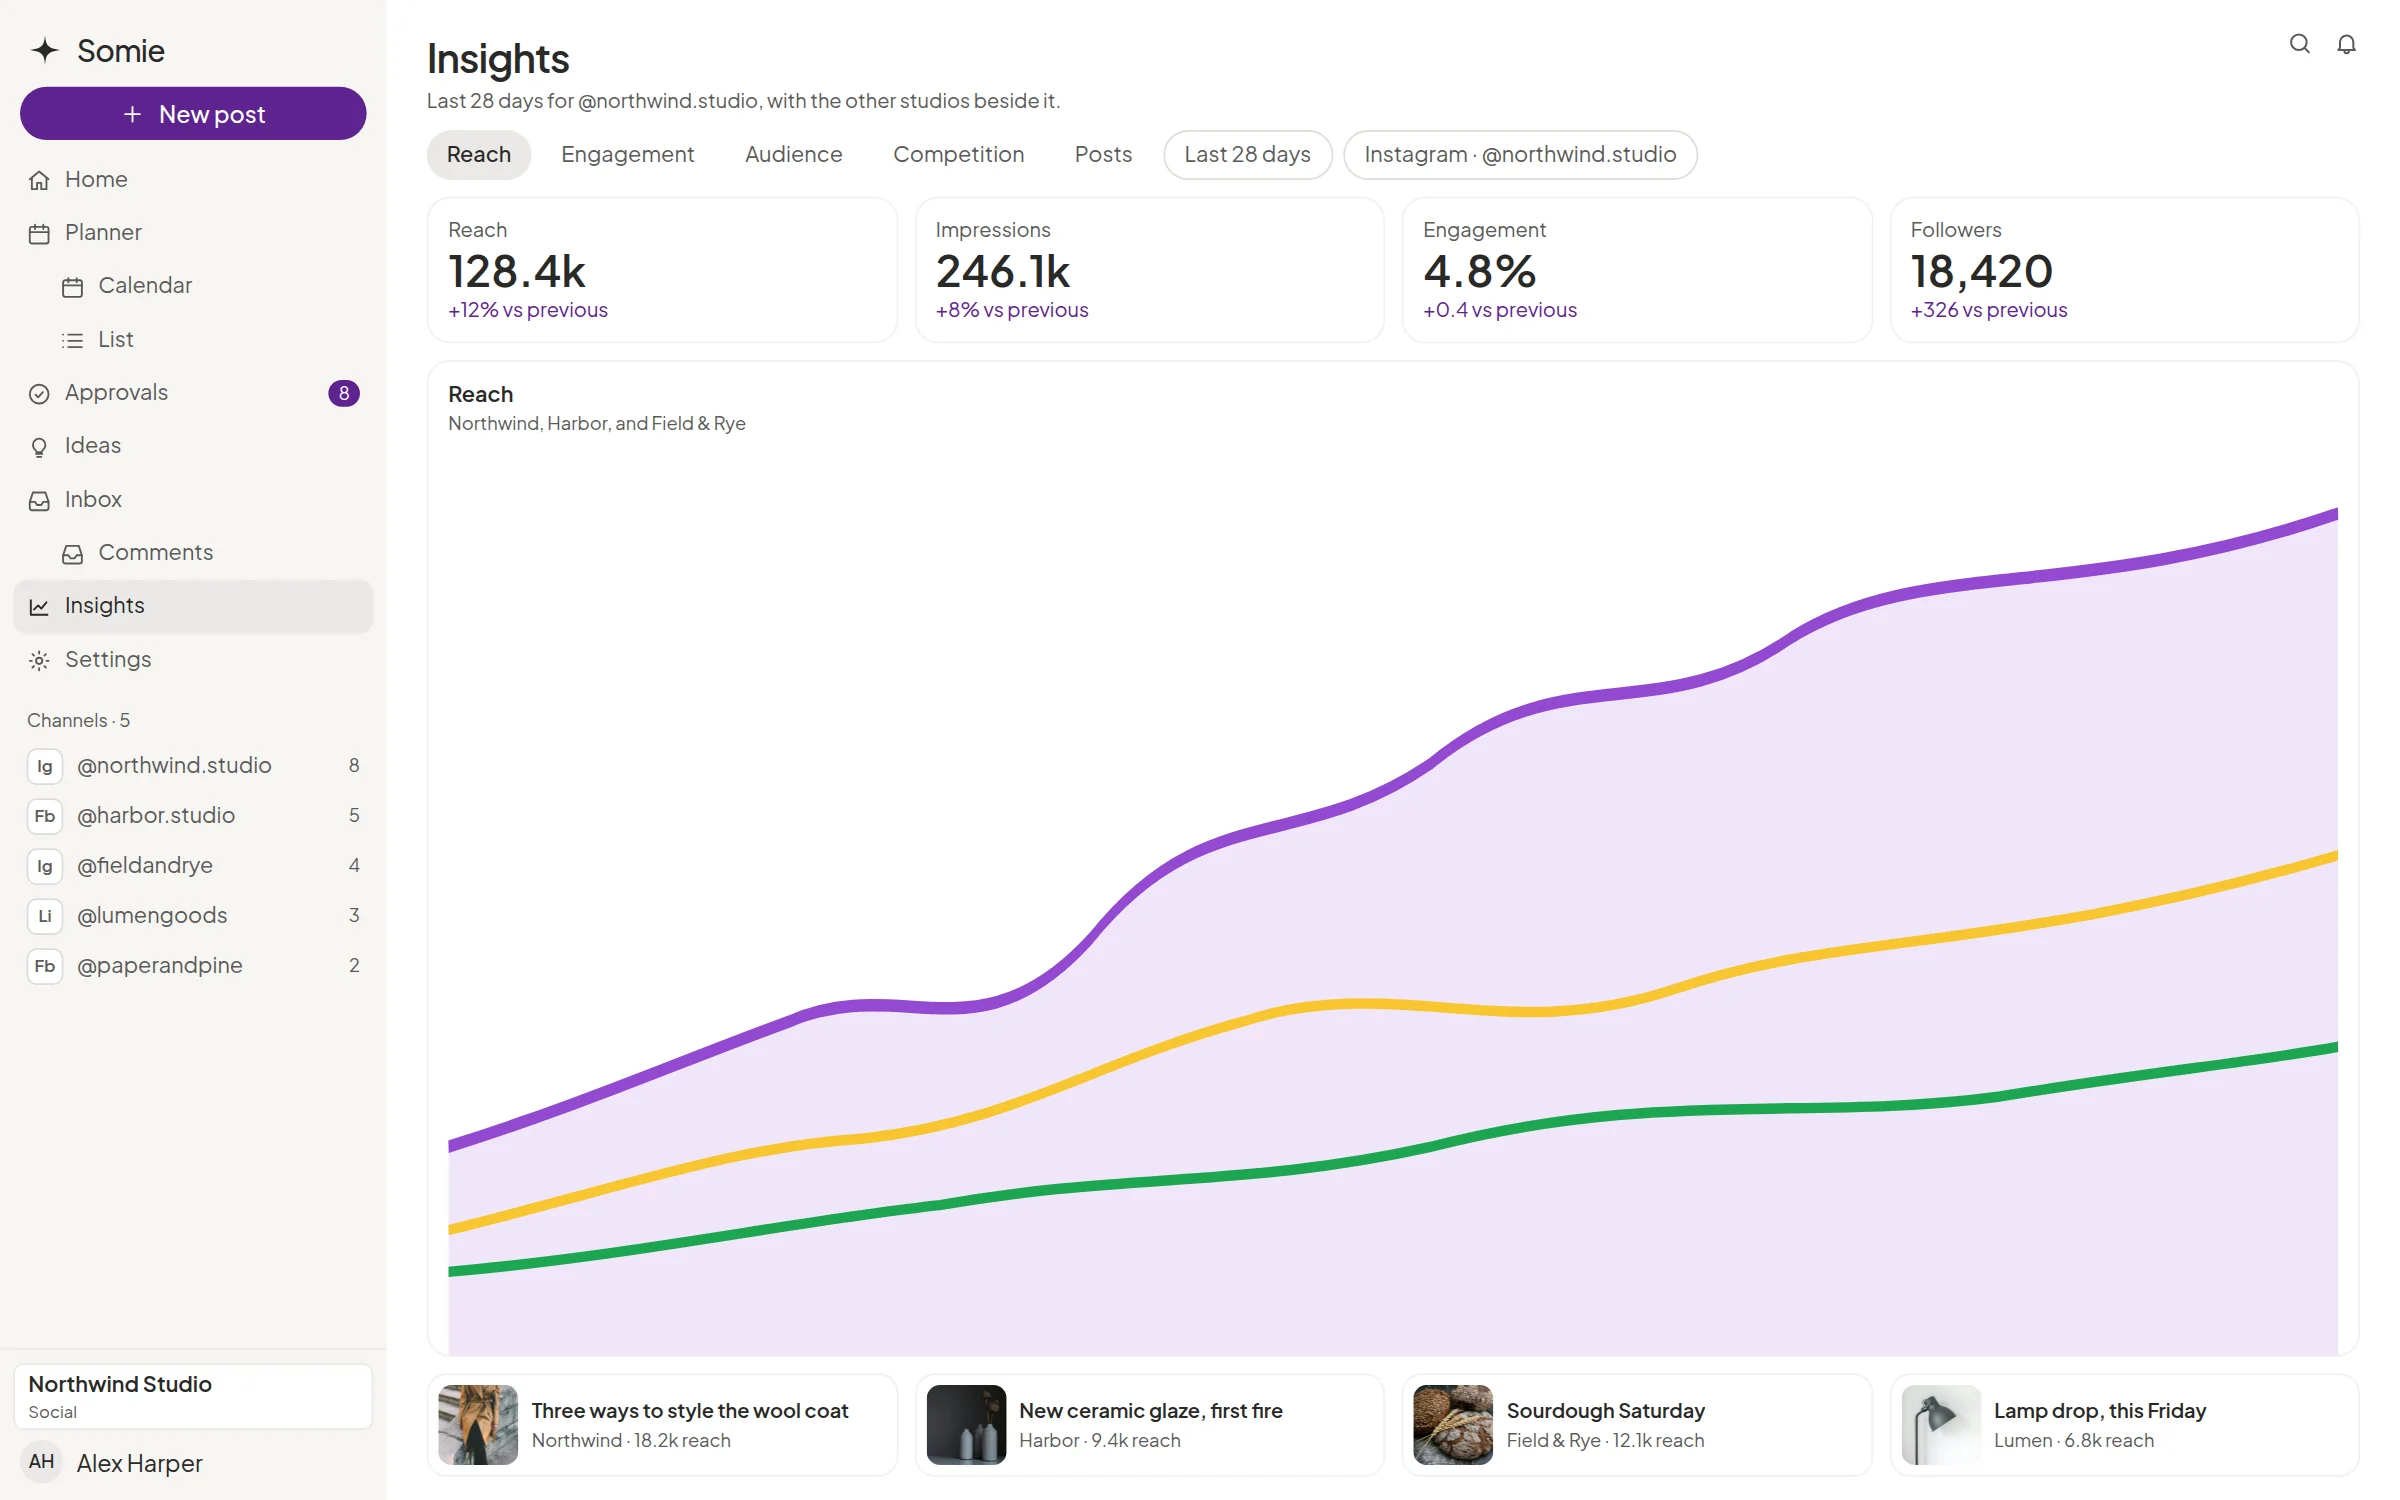

Period, charts, and audience
Choose the range, then read reach, engagement, audience, and the posts that carried the month.

Stories archive
Facebook and Instagram stories are kept on their own tab, separate from the feed posts.

Competition
Compare the client’s profiles with the competitor profiles you track, in the same Insights view.

Looker Studio in the workspace
A Looker Studio report can be embedded in the workspace, next to the posts the client approved.

What the client sees
The report is part of that client’s space. You walk into the monthly meeting from the same place the client approved the work.
Explore more features

Competitors
The client’s profiles beside the ones they watch, ready for the meeting.

Planner
The month on a calendar and a list, in the client’s own space.
Inbox
Comments and messages in one queue, with the post still beside the thread.

Approvals
The client accepts, requests changes, or moves the date in their own space.
Questions about insights
Does Somie replace Looker Studio?
Somie has its own Insights and can show a Looker Studio report inside the client space. Use whichever view the meeting needs.
How far back does the history go?
Somie shows the statistics available from the connected accounts for the range you choose. This site does not promise a fixed number of years of backfill.